“How can I access specific data within my data set?”
“How can Python and Pandas help me to analyse my data?”
Learning objectives:
Describe what 0-based indexing is.
Manipulate and extract data using column headings and index locations.
Employ slicing to select sets of data from a DataFrame.
Employ label and integer-based indexing to select ranges of data in a dataframe.
Reassign values within subsets of a DataFrame.
Create a copy of a DataFrame.
“Query /select a subset of data using a set of criteria using the following operators: =, !=, >, <, >=, <=.”
Locate subsets of data using masks.
Describe BOOLEAN objects in Python and manipulate data using BOOLEANs.
In this lesson, we will explore ways to access different parts of the data in a Pandas DataFrame using:
Indexing,
Slicing, and
Subsetting
Indexing, Slicing and Subsetting
In this lesson, we will explore ways to access different parts of the data in a Pandas DataFrame using:
Indexing,
Slicing, and
Subsetting
Ensure the Pandas package is installed
!pip install pandas matplotlib
Requirement already satisfied: pandas in /opt/hostedtoolcache/Python/3.10.14/x64/lib/python3.10/site-packages (2.2.2)
Requirement already satisfied: matplotlib in /opt/hostedtoolcache/Python/3.10.14/x64/lib/python3.10/site-packages (3.9.0)
Requirement already satisfied: numpy>=1.22.4 in /opt/hostedtoolcache/Python/3.10.14/x64/lib/python3.10/site-packages (from pandas) (2.0.0)
Requirement already satisfied: python-dateutil>=2.8.2 in /opt/hostedtoolcache/Python/3.10.14/x64/lib/python3.10/site-packages (from pandas) (2.9.0.post0)
Requirement already satisfied: pytz>=2020.1 in /opt/hostedtoolcache/Python/3.10.14/x64/lib/python3.10/site-packages (from pandas) (2024.1)
Requirement already satisfied: tzdata>=2022.7 in /opt/hostedtoolcache/Python/3.10.14/x64/lib/python3.10/site-packages (from pandas) (2024.1)
Requirement already satisfied: contourpy>=1.0.1 in /opt/hostedtoolcache/Python/3.10.14/x64/lib/python3.10/site-packages (from matplotlib) (1.2.1)
Requirement already satisfied: cycler>=0.10 in /opt/hostedtoolcache/Python/3.10.14/x64/lib/python3.10/site-packages (from matplotlib) (0.12.1)
Requirement already satisfied: fonttools>=4.22.0 in /opt/hostedtoolcache/Python/3.10.14/x64/lib/python3.10/site-packages (from matplotlib) (4.53.0)
Requirement already satisfied: kiwisolver>=1.3.1 in /opt/hostedtoolcache/Python/3.10.14/x64/lib/python3.10/site-packages (from matplotlib) (1.4.5)
Requirement already satisfied: packaging>=20.0 in /opt/hostedtoolcache/Python/3.10.14/x64/lib/python3.10/site-packages (from matplotlib) (24.1)
Requirement already satisfied: pillow>=8 in /opt/hostedtoolcache/Python/3.10.14/x64/lib/python3.10/site-packages (from matplotlib) (10.3.0)
Requirement already satisfied: pyparsing>=2.3.1 in /opt/hostedtoolcache/Python/3.10.14/x64/lib/python3.10/site-packages (from matplotlib) (3.1.2)
Requirement already satisfied: six>=1.5 in /opt/hostedtoolcache/Python/3.10.14/x64/lib/python3.10/site-packages (from python-dateutil>=2.8.2->pandas) (1.16.0)

[notice] A new release of pip is available: 24.1 -> 24.1.1
[notice] To update, run: pip install --upgrade pip
Loading our data
We will continue to use the surveys dataset that we worked with in the last lesson. Let’s reopen and read in the data again:
# Make sure pandas is loadedimport pandas as pd# Read in the survey CSVsurveys_df = pd.read_csv("surveys.csv")
Indexing and Slicing in Python
We often want to work with subsets of a DataFrame object. There are different ways to accomplish this including: using labels (column headings), numeric ranges, or specific x,y index locations.
Selecting data using Labels (Column Headings)
We use square brackets [] to select a subset of an Python object. For example, we can select all data from a column named species_id from the surveys_df DataFrame by name. There are two ways to do this:
# Method 1: select a 'subset' of the data using the column namesurveys_df['species_id'].head()
We can also create a new object that contains only the data within the species_id column as follows:
# Creates an object, surveys_species, that only contains the `species_id` columnsurveys_species = surveys_df['species_id']
We can pass a list of column names too, as an index to select columns in that order. This is useful when we need to reorganize our data.
NOTE: If a column name is not contained in the DataFrame, an exception (error) will be raised.
# Select the species and plot columns from the DataFramesurveys_df[['species_id', 'site_id']].head()
species_id
site_id
0
NL
2
1
NL
3
2
DM
2
3
DM
7
4
DM
3
What happens if you ask for a column that doesn’t exist?
surveys_df['speciess']
Outputs:
---------------------------------------------------------------------------KeyError Traceback (most recent call last)/Applications/anaconda/lib/python3.6/site-packages/pandas/core/indexes/base.py in get_loc(self, key, method, tolerance)2392try:->2393returnself._engine.get_loc(key)2394exceptKeyError:pandas/_libs/index.pyx in pandas._libs.index.IndexEngine.get_loc (pandas/_libs/index.c:5239)()pandas/_libs/index.pyx in pandas._libs.index.IndexEngine.get_loc (pandas/_libs/index.c:5085)()pandas/_libs/hashtable_class_helper.pxi in pandas._libs.hashtable.PyObjectHashTable.get_item (pandas/_libs/hashtable.c:20405)()pandas/_libs/hashtable_class_helper.pxi in pandas._libs.hashtable.PyObjectHashTable.get_item (pandas/_libs/hashtable.c:20359)()KeyError: 'speciess'During handling of the above exception, another exception occurred:KeyError Traceback (most recent call last)<ipython-input-7-7d65fa0158b8>in<module>()12# What happens if you ask for a column that doesn't exist?---->3 surveys_df['speciess']4/Applications/anaconda/lib/python3.6/site-packages/pandas/core/frame.py in__getitem__(self, key)2060returnself._getitem_multilevel(key)2061else:->2062returnself._getitem_column(key)20632064def _getitem_column(self, key):/Applications/anaconda/lib/python3.6/site-packages/pandas/core/frame.py in _getitem_column(self, key)2067# get column2068ifself.columns.is_unique:->2069returnself._get_item_cache(key)20702071# duplicate columns & possible reduce dimensionality/Applications/anaconda/lib/python3.6/site-packages/pandas/core/generic.py in _get_item_cache(self, item)1532 res = cache.get(item)1533if res isNone:->1534 values =self._data.get(item)1535 res =self._box_item_values(item, values)1536 cache[item] = res/Applications/anaconda/lib/python3.6/site-packages/pandas/core/internals.py in get(self, item, fastpath)35883589ifnot isnull(item):->3590 loc =self.items.get_loc(item)3591else:3592 indexer = np.arange(len(self.items))[isnull(self.items)]/Applications/anaconda/lib/python3.6/site-packages/pandas/core/indexes/base.py in get_loc(self, key, method, tolerance)2393returnself._engine.get_loc(key)2394exceptKeyError:->2395returnself._engine.get_loc(self._maybe_cast_indexer(key))23962397 indexer =self.get_indexer([key], method=method, tolerance=tolerance)pandas/_libs/index.pyx in pandas._libs.index.IndexEngine.get_loc (pandas/_libs/index.c:5239)()pandas/_libs/index.pyx in pandas._libs.index.IndexEngine.get_loc (pandas/_libs/index.c:5085)()pandas/_libs/hashtable_class_helper.pxi in pandas._libs.hashtable.PyObjectHashTable.get_item (pandas/_libs/hashtable.c:20405)()pandas/_libs/hashtable_class_helper.pxi in pandas._libs.hashtable.PyObjectHashTable.get_item (pandas/_libs/hashtable.c:20359)()KeyError: 'speciess'
Python tells us what type of error it is in the traceback, at the bottom it says KeyError: 'speciess' which means that speciess is not a column name (or Key in the related python data type dictionary).
# What happens when you flip the order?surveys_df[['site_id', 'species_id']].head()
site_id
species_id
0
2
NL
1
3
NL
2
2
DM
3
7
DM
4
3
DM
Extracting Range based Subsets: Slicing
REMINDER: Python Uses 0-based Indexing
Let’s remind ourselves that Python uses 0-based indexing. This means that the first element in an object is located at position 0. This is different from other tools like R and Matlab that index elements within objects starting at 1.
# Create a list of numbers:a = [1, 2, 3, 4, 5]
Challenge - Extracting data
What value does the code a[0] return?
How about this: a[5]
In the example above, calling a[5] returns an error. Why is that?
What about a[len(a)] ?
Solutions - Extracting data
a[0]
1
# Solution #2# a[5]
Solution #2
In above example, the error says list index out of range. This means we don’t have index 5 in our list. The maximum index for a is 4, as indexing starts at 0.
# Solution #3# a[len(a)]
Solution - # 4 - Extracting data
This also gives an error, because len(a) is 5 which is not the maximum index
Slicing Subsets of Rows in Python
Slicing using the [] operator selects a set of rows and/or columns from a DataFrame. To slice out a set of rows, you use the following syntax: data[start:stop]. When slicing in pandas the start bound is included in the output. The stop bound is one step BEYOND the row you want to select. So if you want to select rows 0, 1 and 2 your code would look like this with our surveys data:
# Select rows 0, 1, 2 (row 3 is not selected)surveys_df[0:3]
record_id
month
day
year
site_id
species_id
sex
hindfoot_length
weight
0
1
7
16
1977
2
NL
M
32.0
NaN
1
2
7
16
1977
3
NL
M
33.0
NaN
2
3
7
16
1977
2
DM
F
37.0
NaN
The stop bound in Python is different from what you might be used to in languages like Matlab and R.
Now lets select the first 5 rows (rows 0, 1, 2, 3, 4).
surveys_df[:5]
record_id
month
day
year
site_id
species_id
sex
hindfoot_length
weight
0
1
7
16
1977
2
NL
M
32.0
NaN
1
2
7
16
1977
3
NL
M
33.0
NaN
2
3
7
16
1977
2
DM
F
37.0
NaN
3
4
7
16
1977
7
DM
M
36.0
NaN
4
5
7
16
1977
3
DM
M
35.0
NaN
# Select the last element in the list# (the slice starts at the last element, and ends at the end of the list)surveys_df[-1:]
record_id
month
day
year
site_id
species_id
sex
hindfoot_length
weight
35548
35549
12
31
2002
5
NaN
NaN
NaN
NaN
We can also reassign values within subsets of our DataFrame.
Let’s create a brand new clean dataframe from the original data CSV file.
surveys_df = pd.read_csv("surveys.csv")
Slicing Subsets of Rows and Columns in Python
We can select specific ranges of our data in both the row and column directions using either label or integer-based indexing.
loc is primarily label based indexing. Integers may be used but they are interpreted as a label.
iloc is primarily integer based indexing
To select a subset of rows and columns from our DataFrame, we can use the iloc method. For example, we can select month, day and year (columns 2, 3 and 4 if we start counting at 1), like this:
iloc[row slicing, column slicing]
surveys_df.iloc[0:3, 1:4]
month
day
year
0
7
16
1977
1
7
16
1977
2
7
16
1977
Notice that we asked for a slice from 0:3. This yielded 3 rows of data. When you ask for 0:3, you are actually telling Python to start at index 0 and select rows 0, 1, 2 up to but not including 3.
Let’s explore some other ways to index and select subsets of data:
# Select all columns for rows of index values 0 and 10surveys_df.loc[[0, 10], :]
record_id
month
day
year
site_id
species_id
sex
hindfoot_length
weight
0
1
7
16
1977
2
NL
M
32.0
NaN
10
11
7
16
1977
5
DS
F
53.0
NaN
# What does this do?surveys_df.loc[0, ['species_id', 'site_id', 'weight']]
species_id     NL
site_id         2
weight        NaN
Name: 0, dtype: object
# What happens when you uncomment and run the code below?# surveys_df.loc[[0, 10, 35549], :]
NOTE: Labels must be found in the DataFrame or you will get a KeyError.
Indexing by labels loc differs from indexing by integers iloc. With loc, the both start bound and the stop bound are inclusive. When using loc, integers can be used, but the integers refer to the index label and not the position. For example, using loc and select 1:4 will get a different result than using iloc to select rows 1:4.
We can also select a specific data value using a row and column location within the DataFrame and iloc indexing:
# Syntax for iloc indexing to finding a specific data elementdat.iloc[row, column]
In following iloc example:
surveys_df.iloc[2, 6]
'F'
Remember that Python indexing begins at 0. So, the index location [2, 6] selects the element that is 3 rows down and 7 columns over in the DataFrame.
Use can use the syntax below when querying data by criteria from a DataFrame. Experiment with selecting various subsets of the “surveys” data.
Equals: ==
Not equals: !=
Greater than, less than: > or <
Greater than or equal to >=
Less than or equal to <=
Challenge - Queries
Select a subset of rows in the surveys_df DataFrame that contain data from the year 1999 and that contain weight values less than or equal to 8. How many rows did you end up with? What did your neighbor get?
(Extra) Use the isin function to find all plots that contain PB and PL species in the “surveys” DataFrame. How many records contain these values?
You can use the isin command in Python to query a DataFrame based upon a list of values as follows:
# To get number of recordssurveys_df[surveys_df['species_id'].isin(['PB', 'PL'])].shape
(2927, 9)
Extra Challenges
(Extra) Create a query that finds all rows with a weight value greater than (>) or equal to 0.
(Extra) The ~ symbol in Python can be used to return the OPPOSITE of the selection that you specify in Python. It is equivalent to is not in. Write a query that selects all rows with sex NOT equal to ‘M’ or ‘F’ in the “surveys” data.
sum(surveys_df["weight"]>=0)
32283
surveys_df[~surveys_df["sex"].isin(['M', 'F'])]
record_id
month
day
year
site_id
species_id
sex
hindfoot_length
weight
13
14
7
16
1977
8
DM
NaN
NaN
NaN
18
19
7
16
1977
4
PF
NaN
NaN
NaN
33
34
7
17
1977
17
DM
NaN
NaN
NaN
56
57
7
18
1977
22
DM
NaN
NaN
NaN
76
77
8
19
1977
4
SS
NaN
NaN
NaN
...
...
...
...
...
...
...
...
...
...
35527
35528
12
31
2002
13
US
NaN
NaN
NaN
35543
35544
12
31
2002
15
US
NaN
NaN
NaN
35544
35545
12
31
2002
15
AH
NaN
NaN
NaN
35545
35546
12
31
2002
15
AH
NaN
NaN
NaN
35548
35549
12
31
2002
5
NaN
NaN
NaN
NaN
2511 rows × 9 columns
Using masks to identify a specific condition
A mask can be useful to locate where a particular subset of values exist or don’t exist - for example, NaN, or “Not a Number” values. To understand masks, we also need to understand BOOLEAN objects in Python.
Boolean values include True or False. For example,
# Set x to 5x =5
# What does the code below return?x >5
False
# How about this?x ==5
True
Extra Challenges - Putting it all together
Create a new DataFrame that only contains observations with sex values that are not female or male. Assign each sex value in the new DataFrame to a new value of ‘x’. Determine the number of null values in the subset.
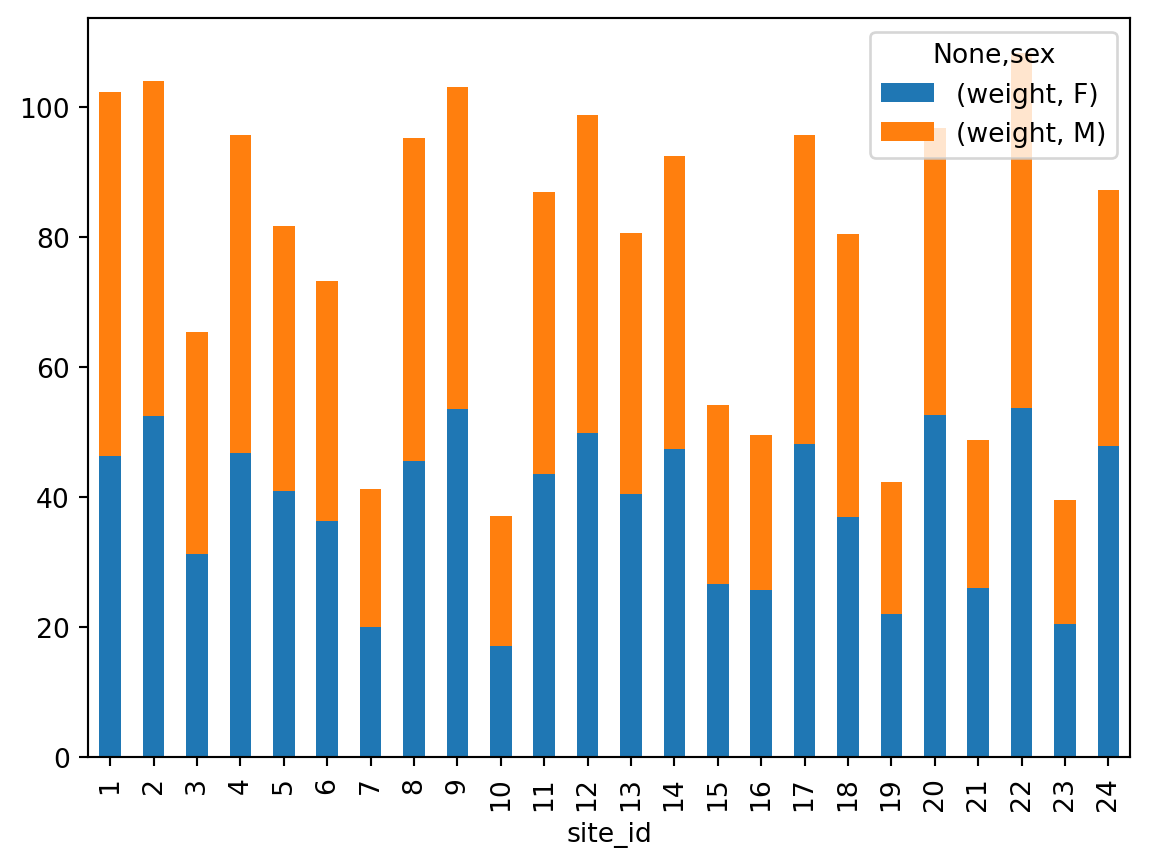
Create a new DataFrame that contains only observations that are of sex male or female and where weight values are greater than 0. Create a stacked bar plot of average weight by plot with male vs female values stacked for each plot.
Count the number of missing values per column. Hint: The method .count() gives you the number of non-NA observations per column.
Solution Extra Challenges
# Solution extra challenge 1new = surveys_df[~surveys_df['sex'].isin(['M', 'F'])].copy()new['sex']='x'print(len(new))
2511
# We can verify the number of NaN values withsum(surveys_df['sex'].isnull())
2511
# Solution extra challenge 2# selection of the data with isinstack_selection = surveys_df[(surveys_df['sex'].isin(['M', 'F'])) & surveys_df["weight"] >0.][["sex", "weight", "site_id"]]# calculate the mean weight for each site id and sex combination:stack_selection = stack_selection.groupby(["site_id", "sex"]).mean().unstack()# Plot inside jupyter notebook%matplotlib inline# and we can make a stacked bar plot from this:stack_selection.plot(kind='bar', stacked=True)